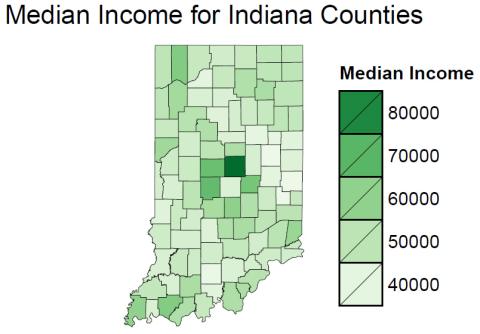
Making maps in R is something that I have been curious about for some time. If you ask a geographer, R probably isn’t at the top of their list for creating maps. Dedicated GIS programs, such as ArcGIS, are most certainly a better choice if your sole interest is in visualizing geographic data. However, creating maps in R has some distinct advantages. For example, R code can easily be shared, collaboratively edited, and versioned using GitHub. Additionally, since R is home to a vast ecosystem of packages, created for almost every purpose under the sun, you can work completely in one system to perform a variety of data transformation and analysis tasks. Below I provide a link to a script and some sample data for mapping the median income of Indiana’s 92 counties. I used Kevin Johnson’s immensely helpful tutorial for creating maps in R as a guide. I tried to provide some more context in the comments of my script that will help the novice R user, but I do assume some basic familiarity.
Readers may want to download RStudio, an integrated development environment for R. While not necessary, this free program is extremely helpful for keeping track of files, managing packages etc. The data were obtained from the American Community Survey and the shapefile from the TIGER/Line Shapefiles produced by the US Census Bureau. All files, including the R script can be downloaded here.